Medicare Part D Drug Spending Dashboard
Interactive dashboard visualizing U.S. government Medicare Part D prescription drug spending (2019–2023), built with Streamlit, Altair, and Plotly.
An interactive, multi-page dashboard providing a transparent look at how the U.S. government allocated funds for Medicare Part D prescription drugs from 2019 to 2023. The project was born out of curiosity for public health economics and being able to turn raw CMS claims data into a clear, visual narrative.
What is Medicare Part D?
Medicare is the U.S. federal health insurance program for people aged 65 and older. Part D is the prescription drug benefit — it covers the cost of medications for enrolled beneficiaries. The government pays a significant portion of these costs, and CMS publishes detailed spending data annually.
Dashboard Pages
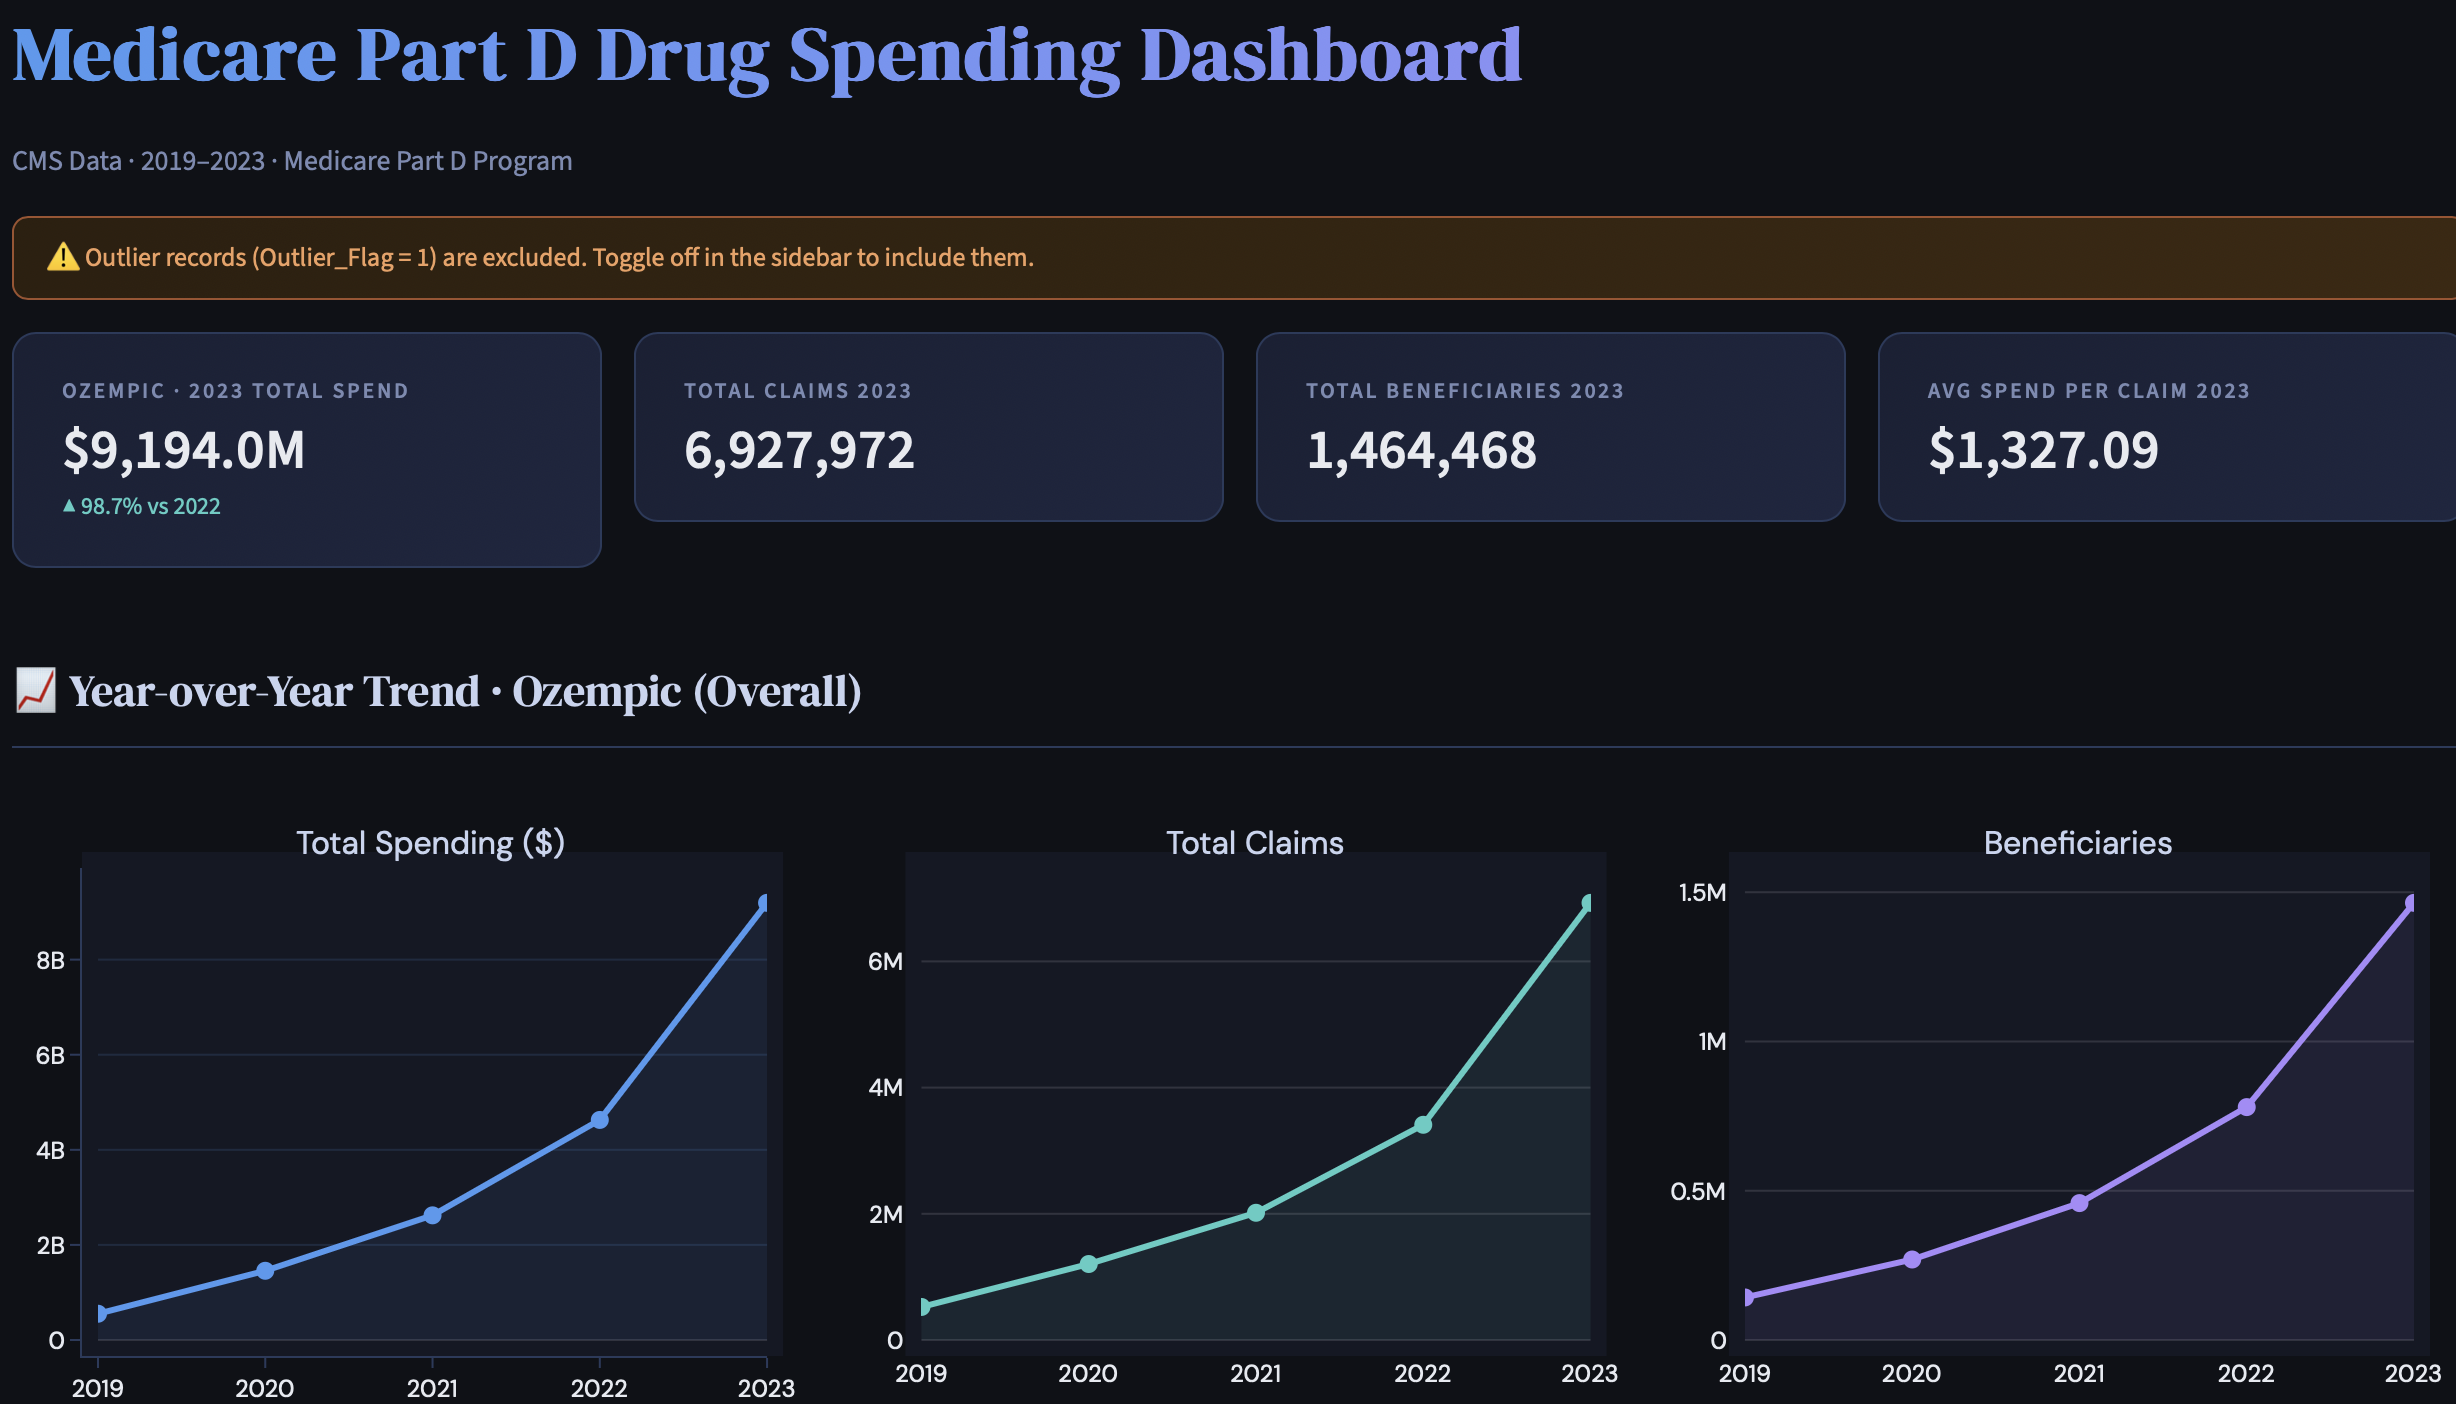
📊 Spending Dashboard
The main analytical view. Use the sidebar to select a drug, adjust filters, and explore the market.
| Section | What it shows |
|---|---|
| KPI Cards | Total spending, claims, beneficiaries, and avg spend per claim for 2023, with YoY change vs. 2022 |
| Year-over-Year Trend | Line charts showing how spending, claims, and beneficiaries evolved for a selected drug from 2019–2023 |
| Manufacturer Spending | Spending across different manufacturers of the same drug over time |
| Claims vs. Beneficiaries Bubble Chart | Scatter plot of top 60 drugs — bubble size = spending, color = fills per beneficiary |
| Price Change (2022 → 2023) | Side-by-side bar charts for largest percentage and dollar price changes |
| 5-Year CAGR vs. 2023 Spending Quadrant | Scatter plot dividing drugs into four quadrants: high/low spending × high/low growth |
| Top N Drugs Ranking | Horizontal bar chart ranked by spending, claims, or beneficiaries |
🧬 Browse by Therapy
Explore drugs grouped by therapeutic category — useful for understanding which disease areas drive the most spending.
- ATC (Mechanism) — groups drugs by how they work in the body (e.g., cardiovascular, nervous system)
- MeSH (Disease / Condition) — groups drugs by the condition they treat (e.g., diabetes, cancer)
💊 Drug Information
A searchable reference of every drug in the dataset, showing brand name, generic name, and a plain-language description. Search by drug name or condition.
Tech Stack
- Framework: Streamlit
- Data Processing: Pandas, NumPy
- Visualization: Altair, Plotly
- Data Source: CMS Medicare Part D Drug Spending Dashboard (2019–2023)
- Drug Enrichment: RxNorm / RxClass APIs (National Library of Medicine)